The complexity of data grows with increase in size of data. When the data volume increases it becomes difficult to understand and needs more time to analyze. In excel we can represent high volume of data to bar charts which makes it easy to understand and gives meaningful insight. In this tutorial we will learn about how to represent the data presented in excel sheet to bar chart using OpenpyXL module in python. Before starting this tutorial please download the dataset. In this tutorial for demo purpose we are going to use a simple dataset which contains only 1 weeks of data but in the real work you may need to play with a large number of rows still the technique is the same.

Barchart:
To plot the bar chart we need to import Barchart, Series and reference module from openpyxl this is simply done by single line of the code.
from openpyxl.chart import BarChart, Series, Reference
After importing the required module we will define a BarChart object and set properties like style,title,y_axis_title,x_axis_title,add_data,set_categories .
chart1 = BarChart()
This line will initiate the chart1 object which refers to the BarChart method.
style:
style properties define the style of chart we are going to create. There are more than 45+ built in chart styles available in the excel. we will specify particular style by the number which is simply the position of that style in excel.
chart1.style = 11
This line defines the 11th style of the excel for the chart1 object.
Title.
To set the title of the chart we will simply pass the string value to title properties to chart object as below.
chart1.title = “Weekly Sales Report”
y_axis_title.
y_axis_title property is used to set the title for data presented in y_axis.
chart1.y_axis.title = ‘Amount’
x_axis_title.
y_axis_title property is used to set the title for data presented in x_axis.
chart1.x_axis.title = ‘Date’
Source Code:
lets compile all together.
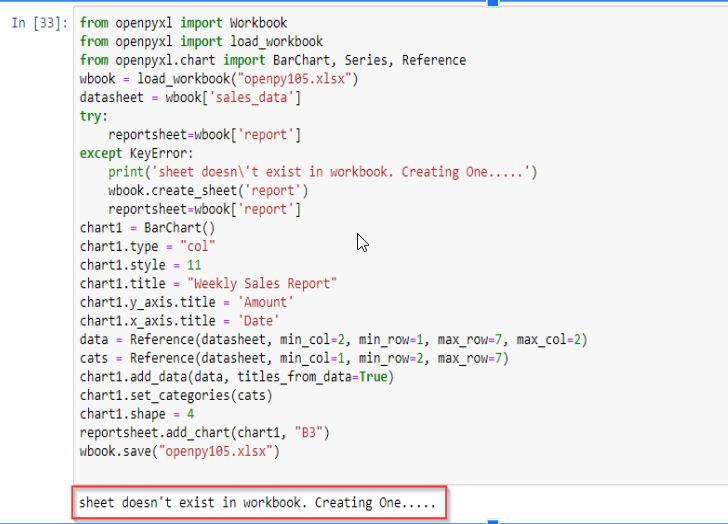
from openpyxl import Workbook
from openpyxl import load_workbook
from openpyxl.chart import BarChart, Series, Reference
wbook = load_workbook("openpy105.xlsx")
datasheet = wbook['sales_data']
try:
    reportsheet=wbook['report']
except KeyError:
    print('sheet doesn\'t exist in workbook. Creating One…..')
    wbook.create_sheet('report')
    reportsheet=wbook['report']
chart1 = BarChart()
chart1.type = "col"
chart1.style = 11
chart1.title = "Weekly Sales Report"
chart1.y_axis.title = 'Amount'
chart1.x_axis.title = 'Date'
data = Reference(datasheet, min_col=2, min_row=1, max_row=7, max_col=2)
cats = Reference(datasheet, min_col=1, min_row=2, max_row=7)
chart1.add_data(data, titles_from_data=True)
chart1.set_categories(cats)
chart1.shape = 4
reportsheet.add_chart(chart1, "B3")
wbook.save("openpy105.xlsx")
Output: